


The typical U.S. homebuyer’s monthly mortgage payment reached $2,641 in the four weeks ending September 6, 2026 — a 14-month high and the highest level since June 2025, according to Redfin. That is the number buyers feel in their checking account, even when headlines fixate on the rate percentage.
Redfin’s seasonally adjusted median payment rose 2.8% year over year. The brokerage tied the climb to a 2.2% rise in the median home-sale price (to about $398,637) and a weekly average mortgage rate of 6.71% in the period it measured. Daily averages later printed higher — Redfin’s leading-indicator table cited a Mortgage News Daily daily average near 6.97% on September 9 — which only sharpens the payment story.
For house hunters and investors, the practical question is not whether rates are elevated. It is what a $2,641 typical payment does to qualification, negotiating power, and the rent-versus-buy decision in fall 2026.
Typical U.S. Mortgage Payment Hits $2,641 — Highest Level in 14 Months
What Redfin’s $2,641 Figure Actually Measures
Redfin’s national metrics cover homes listed and/or sold across 900-plus U.S. metros. The payment print is a seasonally adjusted median monthly mortgage payment based on recent sale prices and the weekly average rate used in that report window. It is not every borrower’s full escrow-inclusive PITI, and it is not a promise that your Loan Estimate will match.
As a gauge of purchase power, though, the dollar payment is clearer than a rate quote alone. A slightly lower rate on a much pricier house can still produce a heavier monthly bill. Redfin’s blend of price and rate is why the payment hit a 14-month high even after this cycle already featured stretches of mid-6% and near-7% financing.
- Median sale price: about $398,637 (+2.2% year over year), per Redfin for the four weeks ending September 6, 2026.
- Median monthly payment (seasonally adjusted): $2,641 at a 6.71% weekly average rate (+2.8% year over year).
- Redfin’s table note: highest payment level since June 2025.
- Median asking price (SA): about $398,584 (+1.1% year over year).
Why the Dollar Payment Matters More Than the Rate Headline
Lenders underwrite income ratios against the projected payment, and households budget cash flow the same way. When the typical payment sits near $2,641 before you layer local taxes and insurance — costs that have also climbed in recent years — a larger share of would-be buyers simply stop touring.
Redfin said elevated costs are keeping some buyers on the sidelines. Pending home sales were essentially flat (+0.1%) week over week on a seasonally adjusted basis and sat near their lowest level since February in that report. Google searches for “homes for sale” were down 15% year over year in the brokerage’s leading indicators. Soft demand is not mysterious when the median check clears higher than it has in more than a year.
That is why this piece is not another rates-near-7% rewrite. Rate percentages move daily. The payment dollar is the product of price and financing costs — and in early September both pushed the typical bill to a 14-month peak.
The Market Buyers Who Stay Actually Face
Paradoxically, Redfin also reported that buyers who remain often have negotiating room. Active listings were up 2.1% year over year (about 1.51 million seasonally adjusted). About 20.8% of listings showed a price drop, up from 19.8% a year earlier. The typical home that sold spent 46 days on the market — one day longer than a year earlier. Months of supply sat at 3.9, still below the classic 4-to-5-month “balanced” band but far from the ultra-tight shelf of 2021–2022.
Competition has not vanished everywhere. Redfin found 25.5% of homes that sold went above asking, slightly above the year-ago share. Agents in competitive pockets still see bidding on well-priced homes. National averages hide the split: soft metros hand leverage to patient buyers; scarce neighborhoods still punish casual lowballs.
| Redfin metric (4 weeks ending Sep 6, 2026) | Reading | Why it matters for a $2,641 payment |
|---|---|---|
| Median payment $2,641 | 14-month high; +2.8% YoY | Qualification and cash-flow ceiling |
| Median sale price ~$398,637 | +2.2% YoY | Price is half the payment equation |
| Active listings +2.1% YoY | ~1.51M SA | More choices if you can clear the payment |
| Price-drop share 20.8% | Up from 19.8% | Room to negotiate sticker, not always rate |
| Sold above list 25.5% | Slightly up YoY | Do not assume every listing is soft |
| Sale-to-list ratio 98.7% | Near year-ago | Discounts exist but are not deep nationally |
What a $2,641 Typical Payment Implies for Household Budgets
Illustrative underwriting math helps frame the barrier. At a common 28% front-end housing ratio, a $2,641 principal-and-interest-style payment implies roughly $9,400+ in gross monthly income — before taxes, insurance, HOA dues, and other debts that feed the back-end ratio. Raise escrow for high-tax or high-insurance counties, and the income needed jumps again.
That is why first-time buyers and rate-sensitive investors feel this print hardest. A household that could stretch for a $2,300 payment earlier in the cycle may now fail automated underwriting or refuse the lifestyle cut. The same affordability squeeze shows up in demographics — see first-time buyers’ record-low 21% share.
Practical Moves If the Payment Is the Constraint
- Shop the payment, not the teaser rate. Ask every lender for the same loan amount, term, and point structure so total monthly cost is comparable.
- Use inventory leverage where it exists. Longer days on market and price cuts often help more than waiting for a mythical sub-6% wave. Pair that with today’s negotiating-power playbook.
- Prefer credits that lower cash to close or buy the rate down when sellers will not cut price enough — covered in closing-cost credits near 7%.
- Widen the search to product mix, not just resale medians. Builders have been pushing more homes under $400,000 — see why more new sales sit under $400K.
- Stress-test year-two escrow. A fixed note rate does not freeze taxes and insurance; payment shock after closing is common — details in why payments can jump $175+ in year 2.
Investor Angle: Yield Math Starts With the Same Payment
Investors underwriting rentals face the same purchase payment as owner-occupants, then add insurance, taxes, maintenance, and softer rent growth in some metros. When the typical buyer payment is at a 14-month high, yields compress unless prices or rents adjust. That helps explain why investor purchase volume has already pulled back — Redfin’s separate investor research put Q1 2026 purchases at the lowest level since 2020, a theme we unpack in investor purchases at a multi-year low.
For yield buyers, a high-payment tape is a filter, not a blanket “wait forever” signal. Only deals with realistic rents, insurance reserves, and purchase discounts large enough to restore margin survive underwriting. National medians will not do that work for you.
Bottom Line on the $2,641 Print
Redfin’s $2,641 typical payment is a 14-month high because sale prices and financing costs rose together in the early-September window. Soft pending demand and more frequent price cuts show the market is not ignoring that number. Buyers who can still clear underwriting should treat the dollar payment as the negotiation target — through price, credits, product choice, and escrow realism — rather than waiting for a single national rate headline to restore affordability on its own.
🏡 High‑Yield Midwest Rentals: Missouri vs Indiana
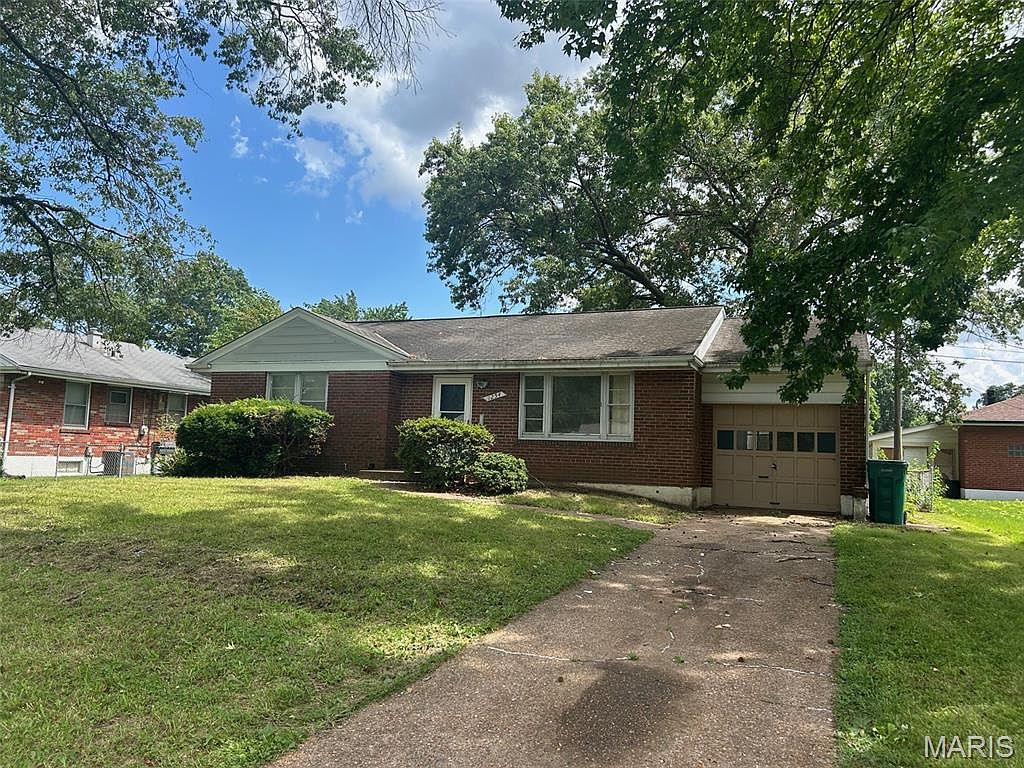
Saint Louis, MO
🏠 Property: Waldorf Dr
🛏️ Beds/Baths: 4 Bed • 1 Bath • 1192 sqft
💰 Price: $145,000 | Rent: $1,500
📊 Cap Rate: 8.7% | NOI: $1,051
📅 Year Built: 1961
📐 Price/Sq Ft: $122
🏙️ Neighborhood: B+
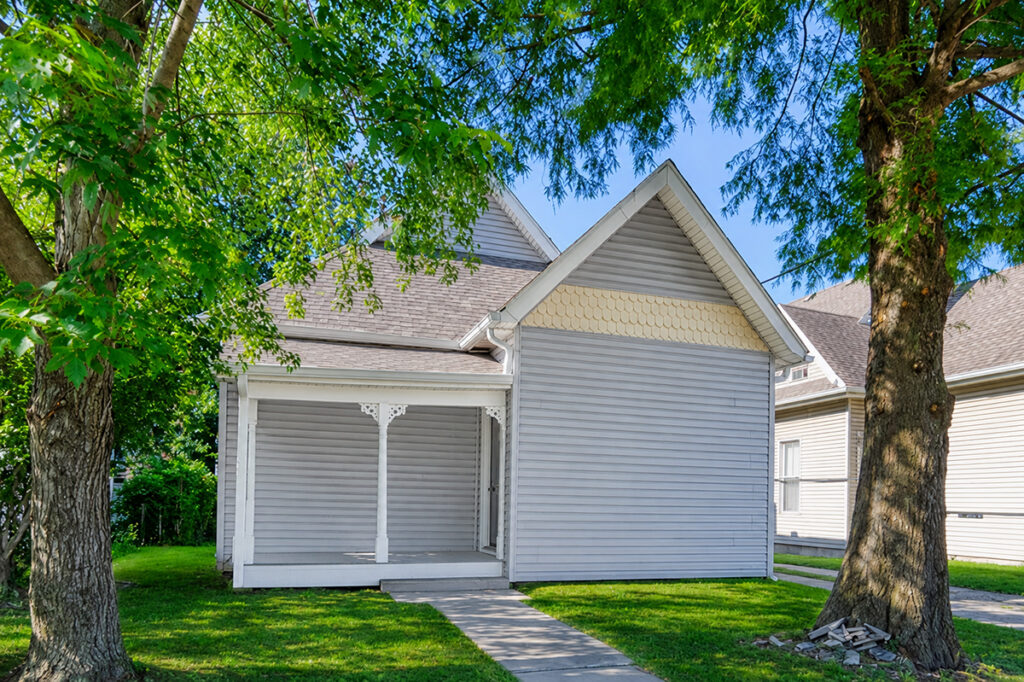
Indianapolis, IN
🏠 Property: E Raymond St
🛏️ Beds/Baths: 2 Bed • 1 Bath • 968 sqft
💰 Price: $192,000 | Rent: $1,550
📊 Cap Rate: 7.4% | NOI: $1,179
📅 Year Built: 1904
📐 Price/Sq Ft: $199
🏙️ Neighborhood: B
Saint Louis offers a budget‑friendly 4‑bed rental with a high cap rate, while Indianapolis provides a classic 2‑bed property with steady cash flow. Which Midwest market fits YOUR investment strategy?
We have much more inventory available than what you see on our website – Let us know about your requirement.
📈 Choose Your Winner & Contact Us Today!
Speak to a Norada Investment Counselor (No Obligation):
(800) 611-3060
