Looking ahead to the next five years, most indicators point to a period of gradual adjustment of mortgage rates rather than a return to extremes from 2026 through 2030. While the ultra-low, sub-3% mortgage rates seen during the pandemic are unlikely to reappear anytime soon, rates are expected to ease modestly.
Current forecasts suggest the 30-year fixed mortgage rate will gradually descend from a 6.0%–6.4% range in 2026 to 5.5%–5.7% by 2030, offering some relief for buyers while confirming the end of exceptionally cheap borrowing. This downward trend is driven by anticipated Fed policy shifts and long-term macro stabilization, reaching a 5.5%–6.0% range by 2028.
Mortgage Rate Predictions for Next 5 Years: 2026 to 2030
As I’m writing this, in May 2026, the average rate for a 30-year fixed mortgage is hovering around 6.51%. That’s up from the lower rates we saw earlier in the year, and it’s still a far cry from the rock-bottom rates of 2021. Why are rates still this elevated? It’s mostly because the market is reacting to sticky inflation numbers and geopolitical tensions.
While the Federal Reserve has enacted some rate cuts since late last year, persistent economic pressures are keeping longer-term borrowing costs high. Right now, the 10-year Treasury yield, a key benchmark for mortgage rates, is around 4.56%.
A Look Back: The Rollercoaster of Mortgage Rates
To understand where we’re going, it’s helpful to see where we’ve been. Over the last quarter-century, mortgage rates have done a real tightrope walk. We’ve seen them soar above 8% in the early 2000s when the economy was booming, and then plunge to historic lows below 3% during the height of the COVID-19 pandemic.
These swings are driven by a mix of factors: the natural ups and downs of the economy, decisions made by the Federal Reserve, and major global events. The jump we saw after 2022, when rates climbed back above 7%, was a direct result of the Fed’s aggressive efforts to combat rising inflation. It really shows us how sensitive mortgage rates are to the overall health of our economy.
Here’s a snapshot of how average annual rates have looked over the years:
| Year | 30-Year Fixed Rate (Approx.) | Key Event(s) |
|---|---|---|
| 2000 | 8.64% | Dot-com boom, Fed hikes |
| 2008 | 6.03% | Financial crisis, rate cuts |
| 2012 | 3.66% | Quantitative easing |
| 2021 | 2.96% | COVID-19 pandemic, ultra-low rates |
| 2023 | 6.81% | Inflation surge, Fed rate hikes |
| 2025 | ~6.50% | Tentative stabilization |
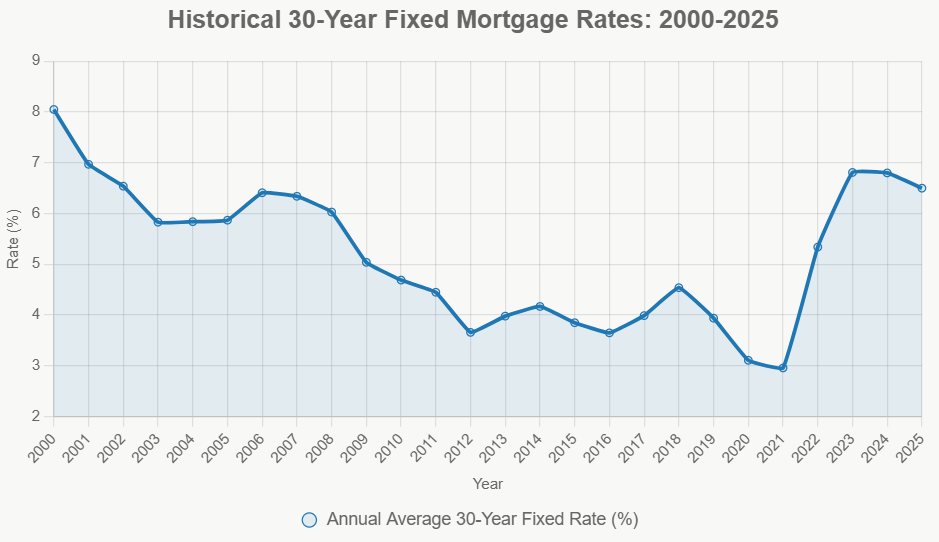
This history teaches us a crucial lesson: rates don’t tend to stay at extreme highs or lows forever. They usually drift back towards their long-term averages as the economy finds its balance. The current average of around 6.50% in 2025, down a bit from 2024, seems to be the start of that return to more normal levels. But, we can’t forget that periods of high inflation, like in the 1980s when rates topped 16%, show us that we should never get too comfortable.
What’s Driving the Rates? The Big Economic Forces
Current mortgage rates are at a nine-month high, in the mid-to-high 6% range (specifically 6.51%-6.63% for the benchmark 30-year fixed rate). This reverses the earlier rate relief from late 2025.
Primary Economic Drivers:
- Geopolitical Turmoil & Energy Costs (Short-Term Driver):
- Cause: Military conflict in Iran (early 2026) leading to the closure of the Strait of Hormuz.
- Impact: Surging crude oil prices, increasing the cost of producing and transporting goods. This creates a “push-pull” effect on rates based on escalation or ceasefire news.
- Stubbornly Resilient Inflation:
- Cause: Consumer Price Index (CPI) reports a 3.8% annual inflation increase, the sharpest in three years and well above the Federal Reserve’s 2% target.
- Impact: Lenders require higher interest rates to protect the future purchasing power of their returns, keeping fixed mortgage rates above 6%.
- Surging 10-Year Treasury Yield:
- Cause: Investors are selling off bonds due to rising inflation and concerns about the U.S. national debt.
- Impact: A bond market sell-off pushes bond yields higher. Mortgage rates are calculated by adding a “spread” (risk margin) to the 10-year Treasury yield. With the 10-year yield exceeding 4.57%, mortgage rates follow suit.
- Frozen Federal Reserve Policy:
- Cause: The Federal Reserve has kept its benchmark federal funds rate frozen at 3.50%-3.75%.
- Impact: While the Fed doesn’t set mortgage rates, its rate influences the cost of credit. The surge in energy-driven inflation prevents the Fed from cutting rates. There’s even a slim possibility of a hike if core inflation doesn’t cool.
- Housing Inventory Crises:
- Cause: A structural supply-and-demand imbalance in the housing market, often referred to as the “lock-in” effect, where existing homeowners with low mortgage rates (below 6%) are reluctant to sell.
- Impact: This severe shortage of available homes keeps purchase prices high despite elevated interest rates. Lenders experience less competitive pressure to lower their profit margins when demand remains strong relative to supply.
Current Conventional Mortgage Rates (May 2026):
- 30-Year Fixed Conforming: 6.51% – 6.63%
- 15-Year Fixed Conforming: 5.85% – 5.97%
- 30-Year Jumbo: 6.63% – 6.77%
- 5/1 Adjustable-Rate (ARM): 6.29% – 6.48%
What Experts Are Saying: A Look at the Forecasts
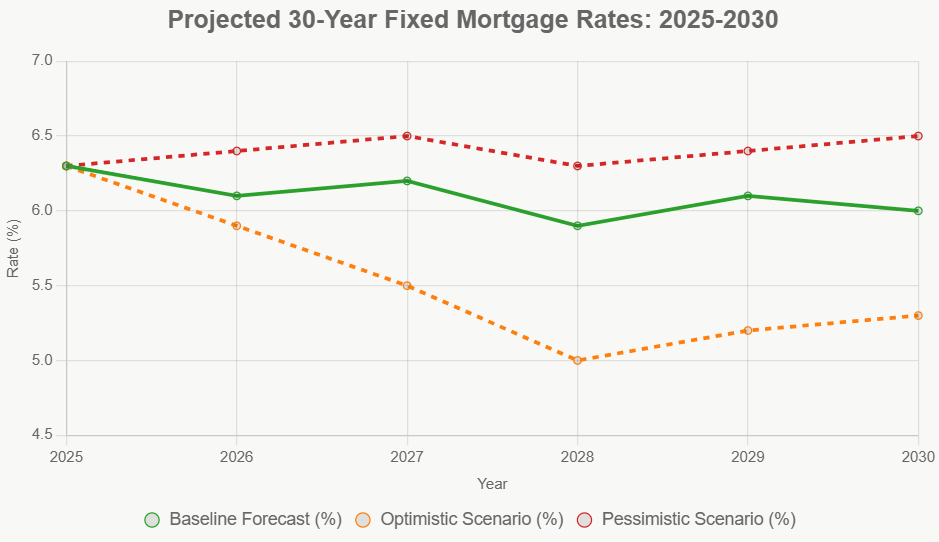
When I look at what other smart people and institutions are predicting, there’s a general sense of cautious optimism. The consensus is that rates will ease somewhat initially and then settle into a more stable range.
Projected 30-Year Fixed Mortgage Rates and Key Economic Drivers (2026-2030)
Long-term mortgage rates are projected to follow a gradual downward trend rather than rapid declines, primarily tracking the 10-year U.S. Treasury yield. This trend will be influenced by an anticipated lender “spread,” which has historically ranged between 1.7 to 2.0 percentage points. Major financial institutions foresee this slow drift, indicating a measured adjustment in the mortgage market.
| Forecast Year | Expected 30-Year Fixed Rate Range | Key Economic Drivers |
|---|---|---|
| 2026 | 6.0% – 6.4% | Fed pauses rate cuts due to Middle East/Iran conflict volatility; inflation remains sticky. |
| 2027 | 5.8% – 6.2% | Fed funds rate reaches a “neutral” 3.125%; Quantitative Tightening (QT) ends. |
| 2028 | 5.5% – 6.0% | 10-year Treasury yield settles near 3.9%; spread risk normalizes. |
| 2029 | 5.5% – 5.8% | Demographics peak (Gen Z and Millennials buying) creating a strong floor for pricing. |
| 2030 | 5.5% – 5.7% | Long-term macro stabilization; mortgage payments-to-income ratios slowly re-normalize. |
Macroeconomic Scenarios for Mortgage Rate Trajectories
To navigate potential financial volatility, consider the three distinct macroeconomic scenarios presented by institutional researchers:
| Scenario | The Trajectory | The Mechanics |
|---|---|---|
| 1. Base Case | Rates gently ease from the low-6% range down to 5.7% by 2030. | The Federal Reserve holds rates steady through most of 2026 before easing to a neutral posture by mid-2027. The Treasury-to-mortgage spread tightens as private markets absorb mortgage-backed securities (MBS) smoothly. |
| 2. Bull Case | Mortgage rates compress quicker, landing near 5.0% by 2030. | Domestic inflation reliably hits the Fed’s 2% target without triggering a hard recession. Global energy markets stabilize, compressing the term premium on bonds and allowing projections to slide to their lowest sustainable baselines. |
| 3. Bear Case | Rates spike toward 7.0% by 2027 before settling at a stubborn 6.6% by 2030. | Expanding U.S. federal budget deficits discourage investors from accepting lower bond yields. Tariff expansions, global supply chain breakdowns, or persistent energy sector inflation force the Fed to maintain restrictive policies. |
Beyond interest rates, deep structural changes are expected to influence the housing cycle through 2030. The “lock-in effect”, where millions of homeowners with low pandemic-era mortgage rates remain in place, is anticipated to ease. Major life events such as divorce, downsizing, or job relocations will likely prompt these homeowners to move, gradually increasing stagnant housing inventory.
Despite potential declines in mortgage rates to the mid-5% range, the market may not feel “financially normal” for buyers until late 2030. This is due to the compounding effects of persistent property taxes, rising home insurance costs, and minor price appreciation, as noted in Redfin’s analysis. Furthermore, the National Association of Realtors (NAR) forecasts a cooling of home price growth, projecting annual increases to be in a sustainable 2% to 4% range, roughly aligning with overall consumer inflation through 2030.
My Final Thoughts: Prudence and Patience
The next five years won’t bring back the days of sub-4% mortgages, and I don’t think we should expect that. However, the predicted gradual easing of mortgage rates, bringing them into the 5.5%–5.7% by 2030, does offer some breathing room for the housing market and for individuals trying to achieve homeownership.
My advice? Keep a close eye on the Federal Reserve’s actions and statements, as they are the primary driver of interest rate policy. Focus on building a strong credit score and saving for a substantial down payment.
Don’t rush into a decision, and always consider consulting with a trusted financial advisor or mortgage professional who can help you navigate the options based on your specific situation. The key to success in the coming years will be agility – being ready to adapt as economic conditions and interest rates evolve.
Invest Smartly in Turnkey Rental Properties
With rates dipping to their lowest levels this year, investors are locking in financing to maximize cash flow and long-term returns.
Norada Real Estate helps you seize this rare opportunity with turnkey rental properties in strong markets—so you can build passive income while borrowing costs remain historically low.
🔥 HOT NEW LISTINGS JUST ADDED! 🔥
Talk to a Norada investment counselor today (No Obligation):
(800) 611-3060